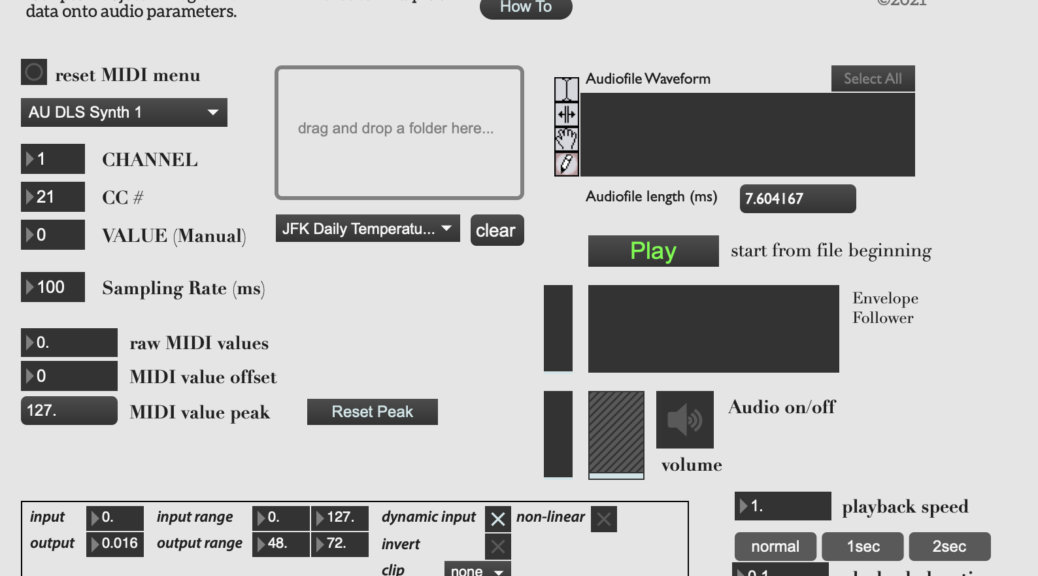
“Envelope Follower to MIDI CC” is a Max/MSP patch and stand-alone application for converting audio files into MIDI CC messages in real-time. Just load an audio file, play it, and you’ll be sending MIDI CC data based upon the amplitude envelope of the audio file. You have controls over MIDI data scaling, sampling rate, audio playback speed, and strict playback duration for mapping projects.
The impetus for the tool comes from not being satisfied with available options to convert audio amplitude into MIDI data for Digital Audio Workstation mapping projects. As a teacher, I wanted to create a resource to enable student mapping that leverages their own digital tools.
I made the software available as a repository on github. You don’t need to Max/MSP to run; I made a basic stand-alone application as well and the link is included on github.
If you dig the free software, please listen, share, and follow my music on Spotify.
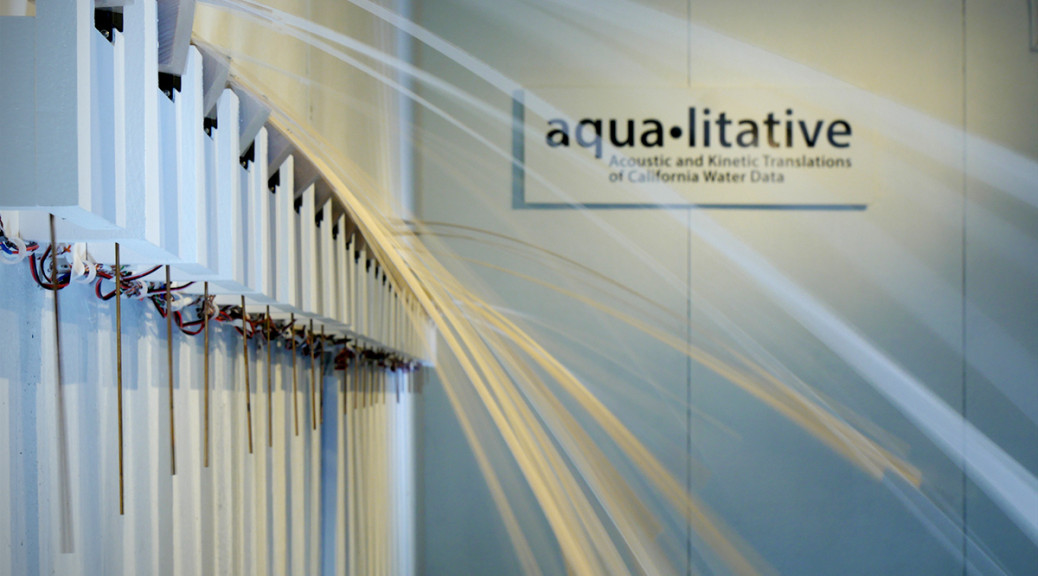
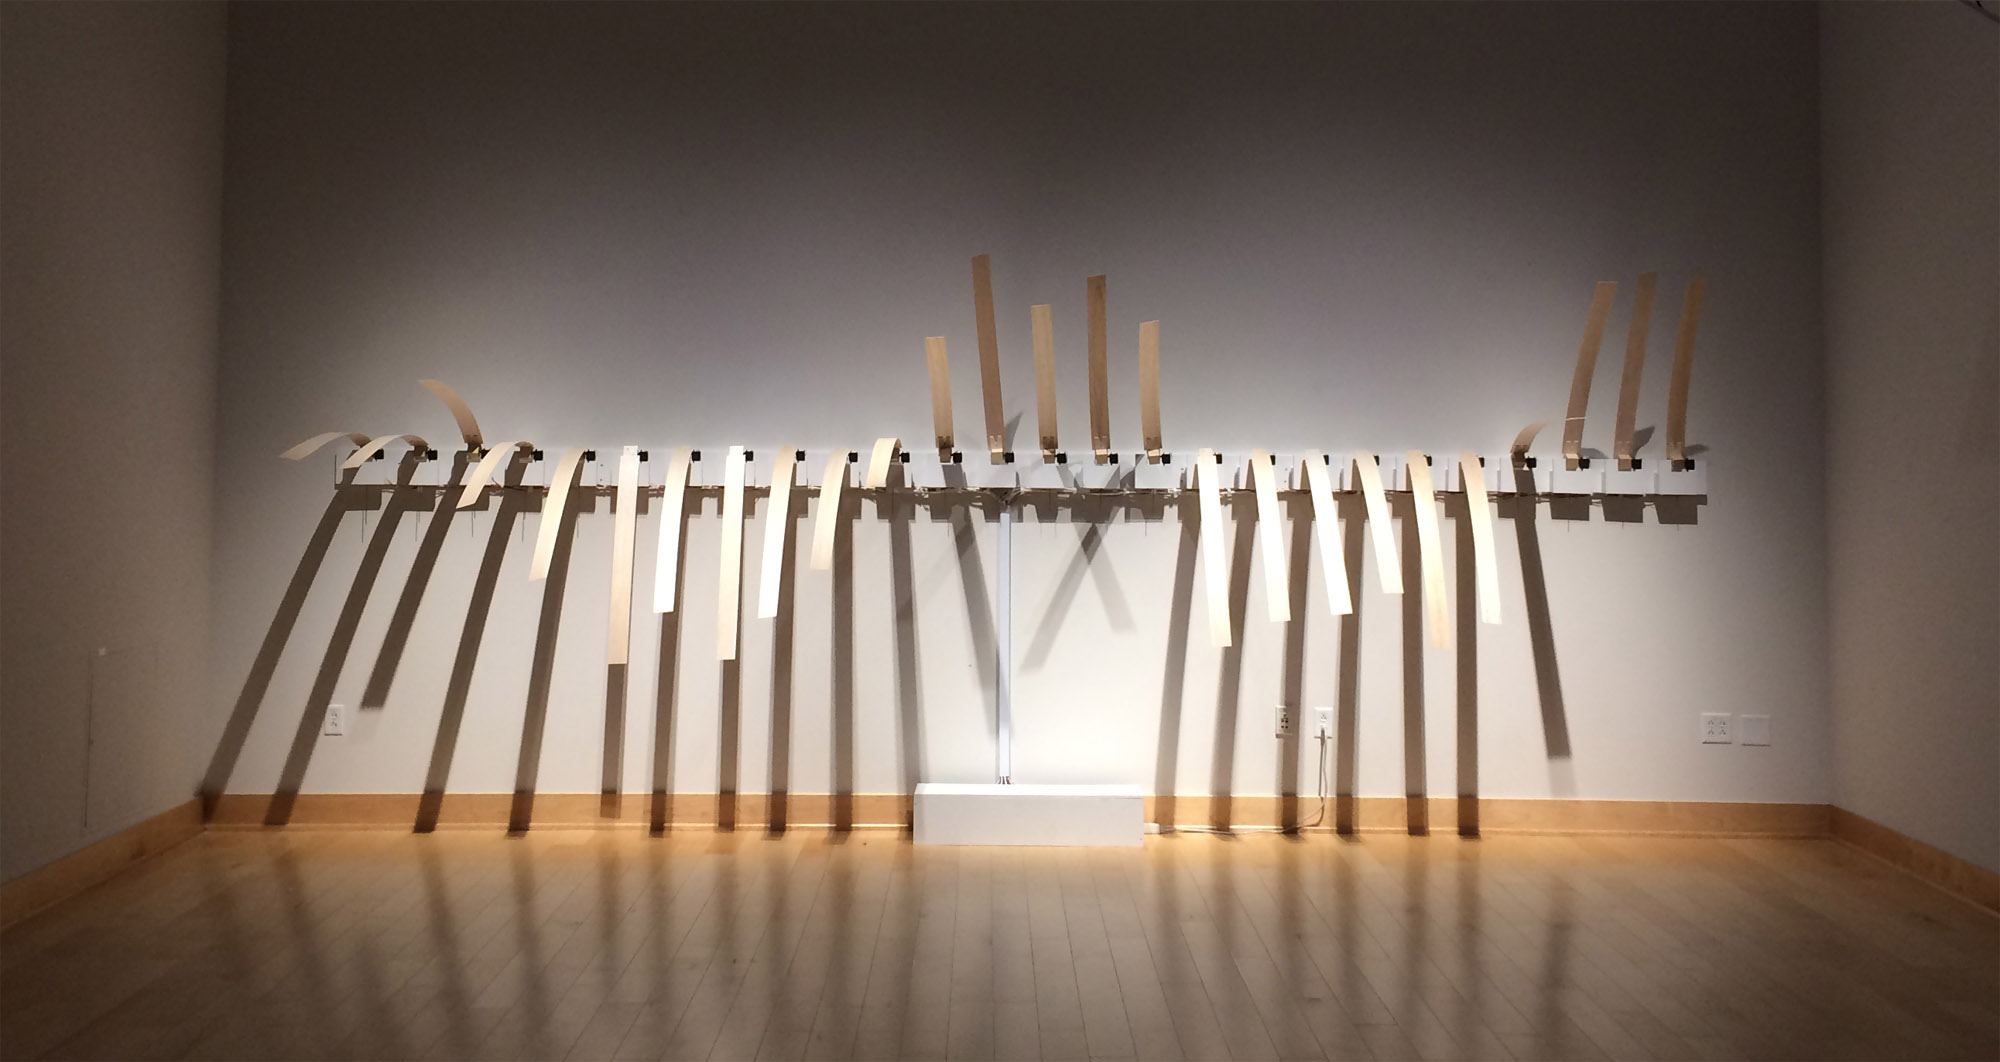
Aqua•litative is a kinetic installation that renders multiple data sets related to California’s water history into movement and sound. The installation displays climatological data as a chronological narrative of water in the state by transforming water data into acoustic sounds (ringing of clock chimes) and physical movement (motors moving arms of balsa wood) shown in a gallery space. Precipitation data creates sonic patterns, analogous to rain droplets, in a continuously evolving play between density and rhythm.
Aqua•litative is by Jon Bellona, John Park, and John Reagan. http://aqualitative.org The installation is part of an Environmental Resilience and Sustainability Fellowship, funded in part by the Jefferson Trust and the University of Virginia Office of Graduate and Postdoctoral Affairs.
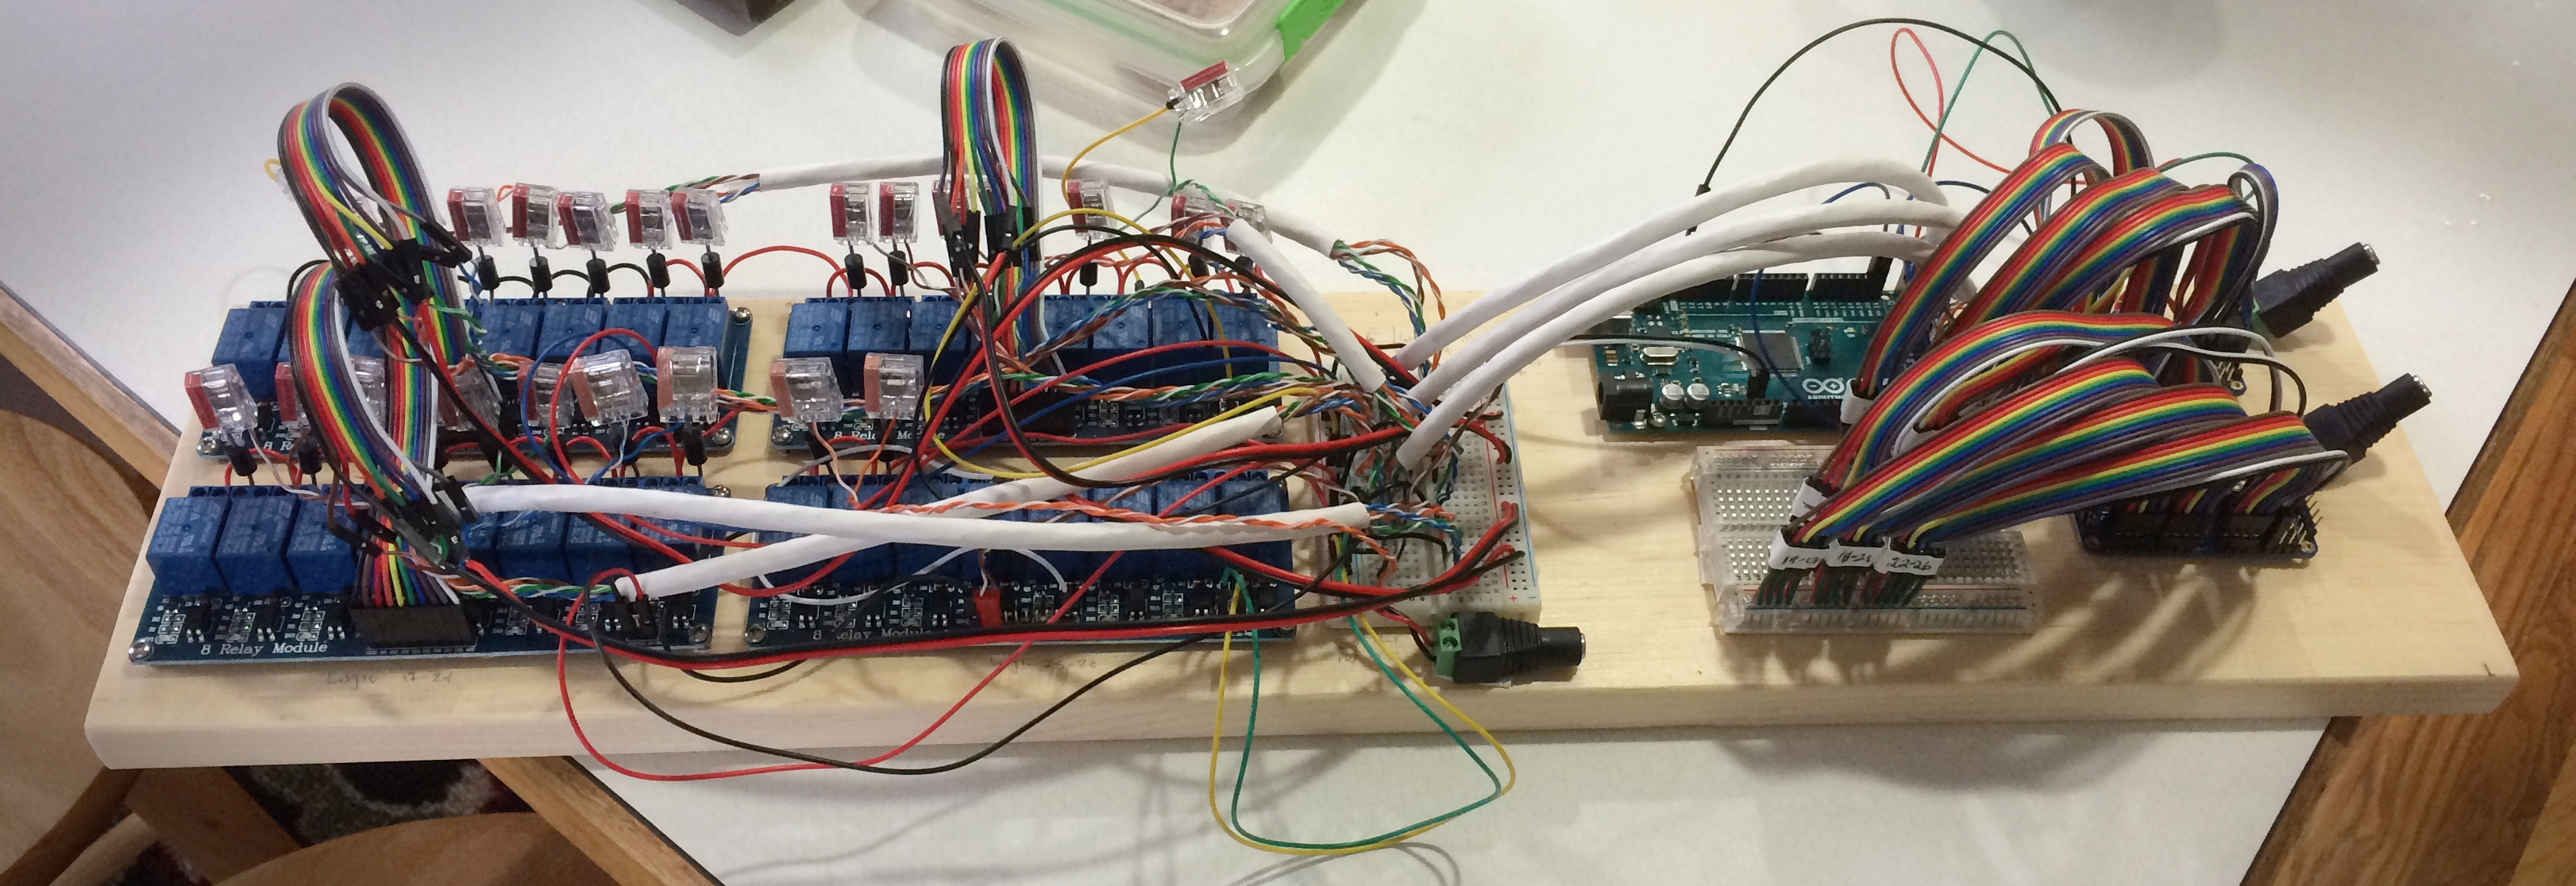
Aqua•litative installed at the Duke Gallery in Harrisonburg, VA Arduino board layout for the installation.
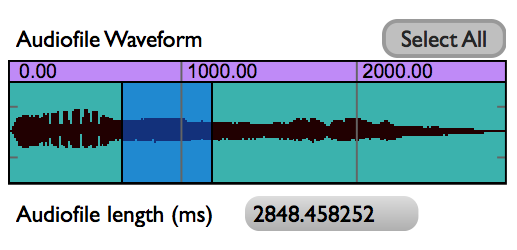
Selecting a portion of an audio sample is something that we do often. Digital Audio Workstations (DAWs) like Logic and ProTools or even Sample Track Editors like Peak and Audacity allow users to select a portion of audio.
Figure 1. Selection of Audio in Audacity.
The process of selecting audio with a mouse for out-of-real-time control (and in the comfort of one’s studio) isn’t a bad paradigm. However, what about live performance contexts? What other paradigms exist, may be altered, or can be created to benefit live performance?
In conversations with Ted Coffey one such idea came up. With the Wacom tablet, one may alter the start and end selection times of an audio sample based upon the pen’s position in XY space. This idea, sample selection times in XY space, is entirely Ted’s and I can take no credit. Still, I was and am excited about his control idea and I really wanted to listen to a sound using the XY control paradigm. This blog post documents my implementation of sample selection times in XY space based upon Ted’s description.
The What
In order to control sample selection times we need to control three things:
a. sample selection start
b. sample selection end
c. start/stop sample
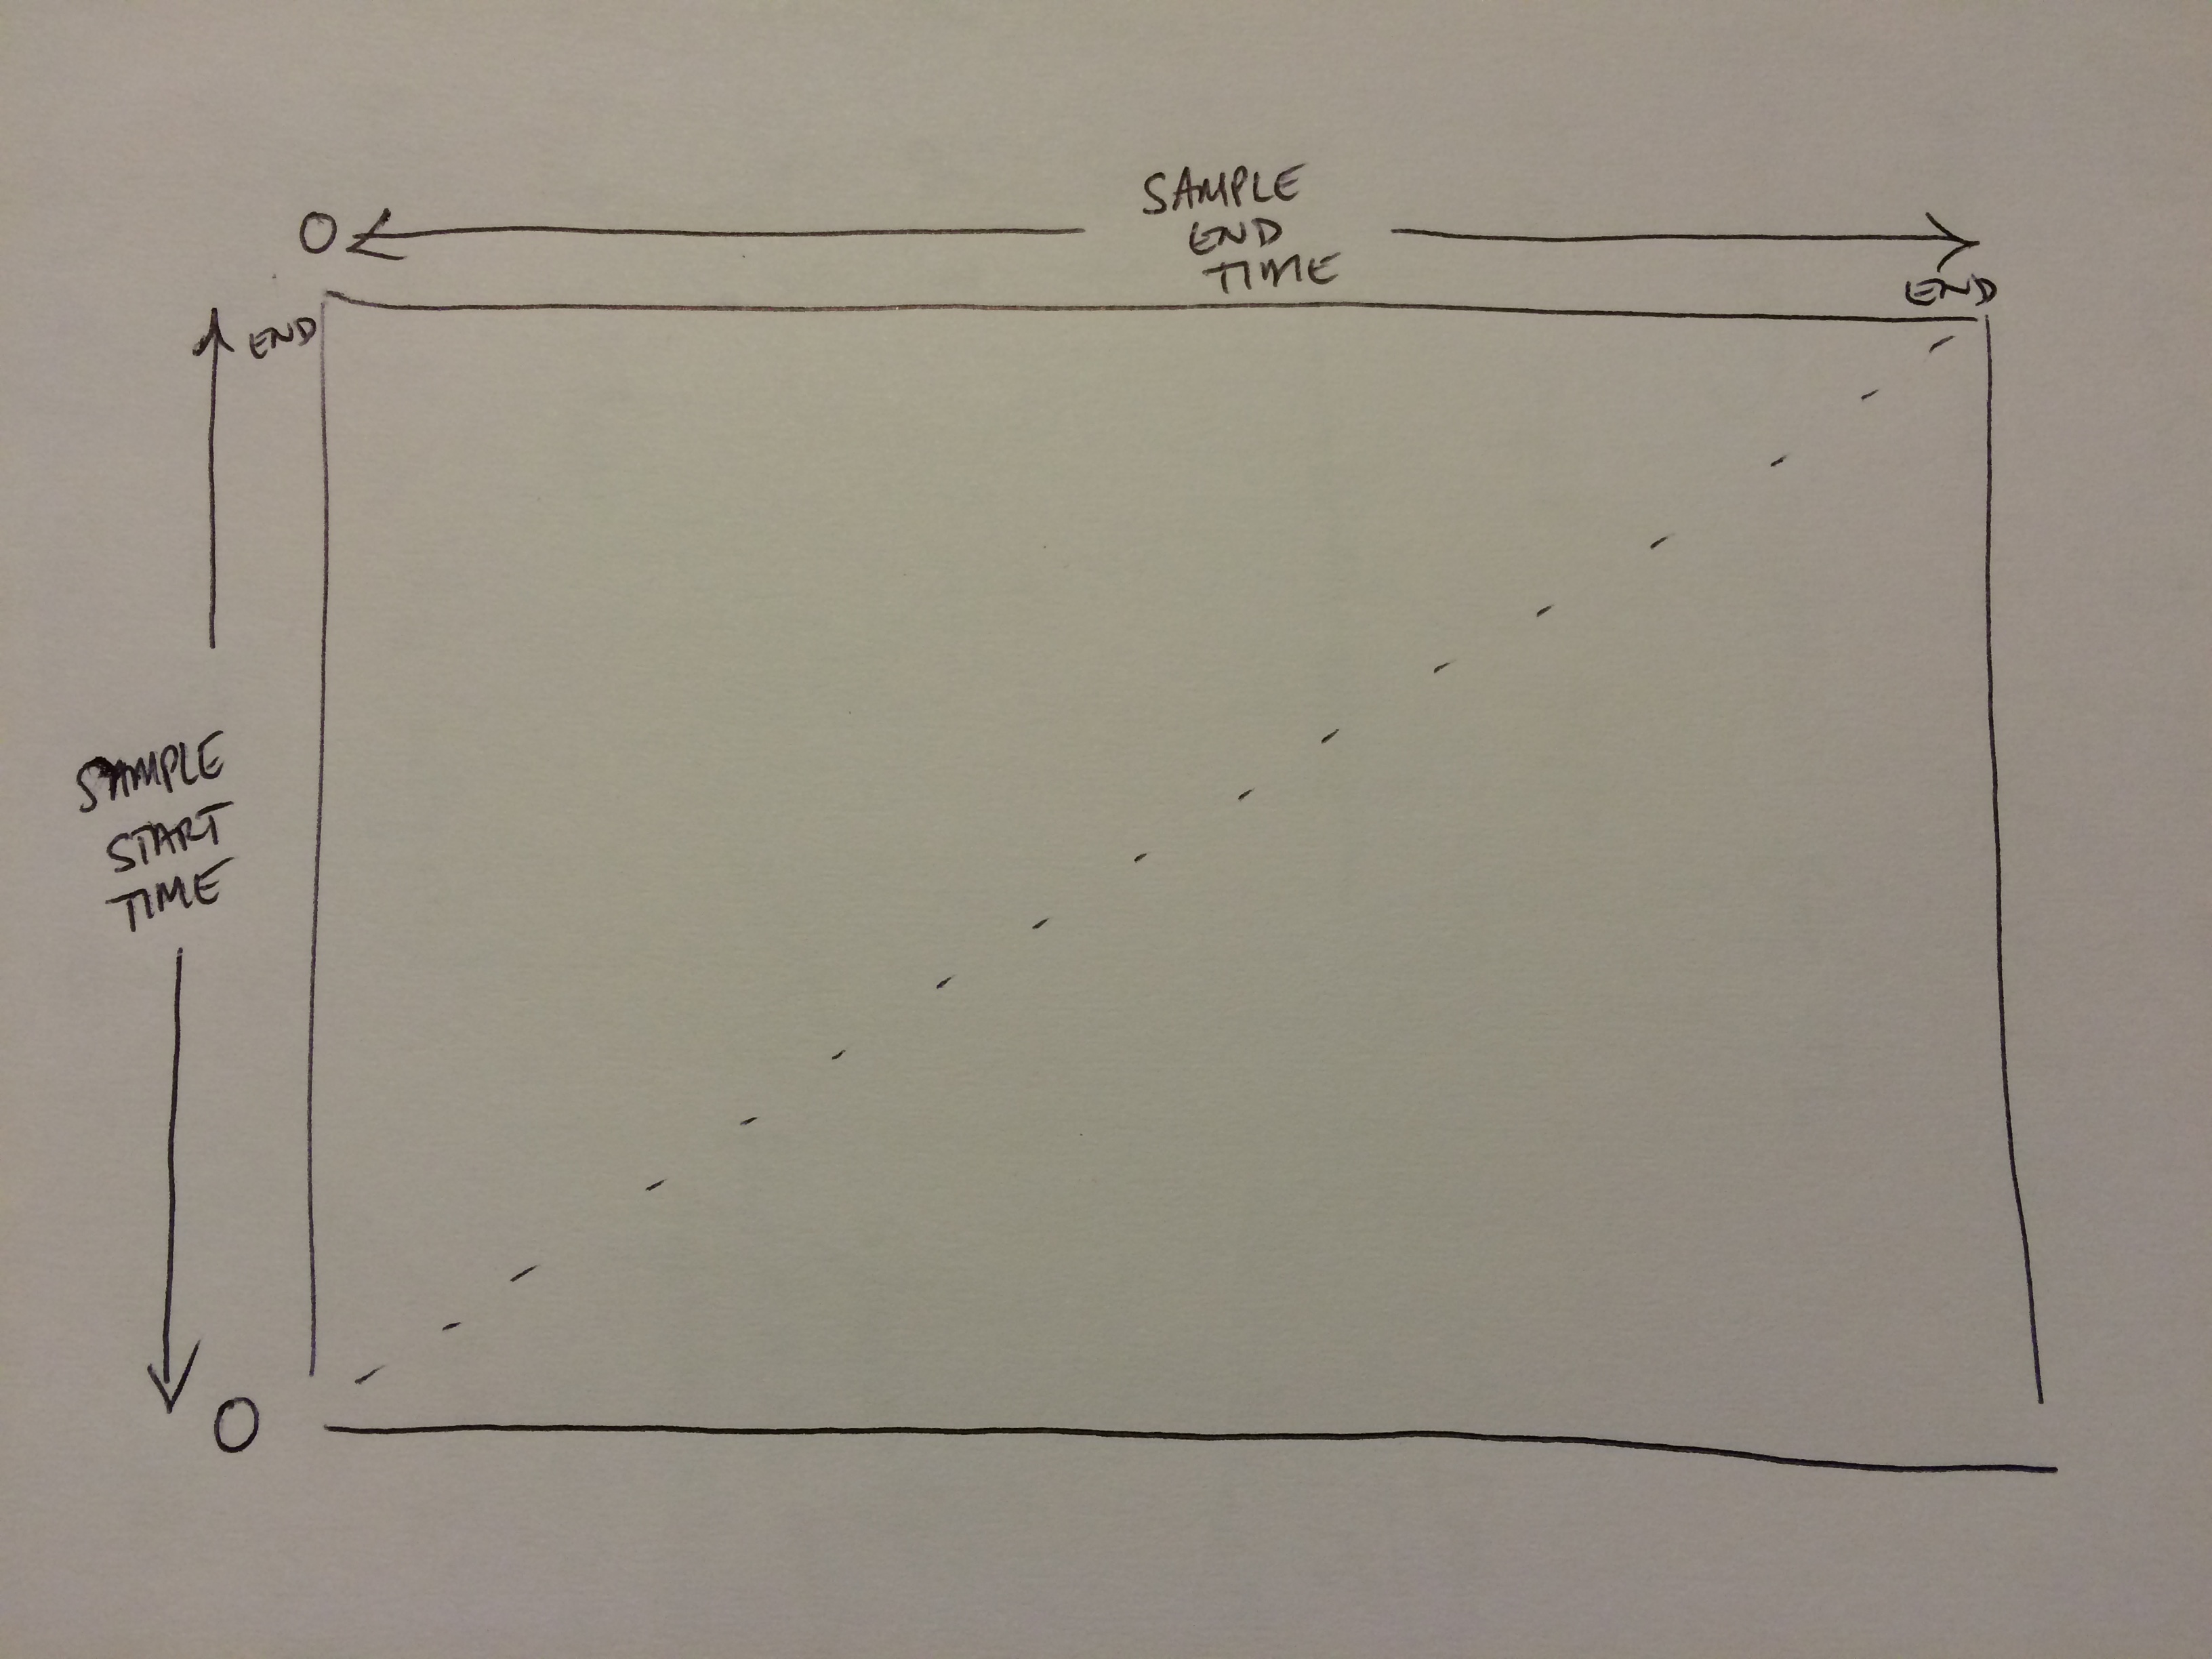
Figure 2. Sketch of sample selection control on the XY axis
Using the Wacom tablet, we map XY space onto the sample selection start and end times (Y-axis is selection start, X-axis is selection end) and use !PenDown to trigger the sample start/release.
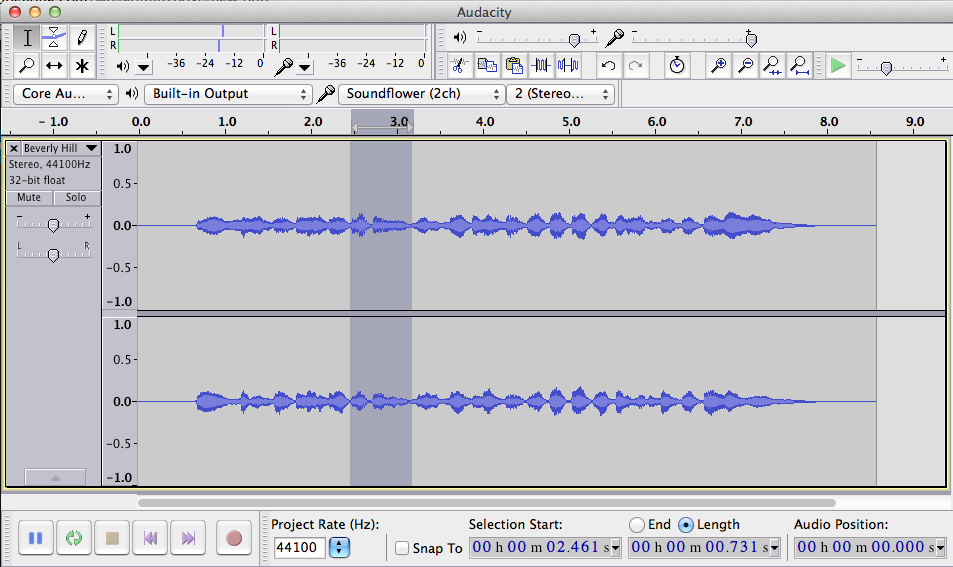
So, what does this sound like? Here are two examples.
The first example uses to pen to scrub different locations of the tablet. Source material is the opening theme to Beverly Hills Cop.
The second example uses grid quantization for the Pen location. Dividing the sample start location and end location times by a beat factor (e.g. 32), we can quantize the length of the selection by a fraction of a beat. Match the playback of this fraction to the !BPM of a drumbeat, and voila! Instant gratification. Source material: Beverly Hills Cop theme + Bob James “Take Me To The Mardi Gras”
To sum up, using XY space to dynamically alter start/end selection times of a sample has strong performance possibilities. For those interested, I’ve shot a quick video of the controls inside Kyma and placed my source Kyma 7 files here.
Quick Kyma notes to no-one but myself:
a. use SampleWithTimeIndex.
b. for Beat quantization,
Duration must be ‘audioFileNameOfDrum’ sampleFileDuration s.
Rate must be !Rate * (!BPM / (‘audioFileNameOfDrum’ closestBPMTo: !BPM forBeats: 64))
Start, End, etc. must use this syntax… ((!PenY * 64.0) rounded / 64.0)
Over the last few months, I’ve been interested in data zooming, where a finite range of data (say 0-1) can be magnified and explored in greater detail. We are all familiar with the paradigm. In Microsoft Word or Photoshop, for example, you zoom the view (e.g. 125%) and in the same amount of screen real estate, you see a smaller region (of words or pixels) in greater detail.
Figure 1. Zoom in of a portion of Salvador Dali’s Dream Caused by the Flight of a Bee Around a Pomegranate a Second Before Awakening painting reveals more detail in same amount of screen real estate.
Zooming is also true for any stream of numbers. In software we can map a fader to move between 0-1 and on a similar fader (or the same fader), map the range to 0.0-0.1 (1/10 of its original range).
Figure 2. Max/MSP fader mapped to different scaling factors.
While a simple concept, data zooming can be a powerful tool. Magnification embodies focus, detail, and exploration. If sound is data or controlled by data, then magnification enables us to literally ‘zoom in’ on audio. Data zooming, then, becomes a way to explore sound space.
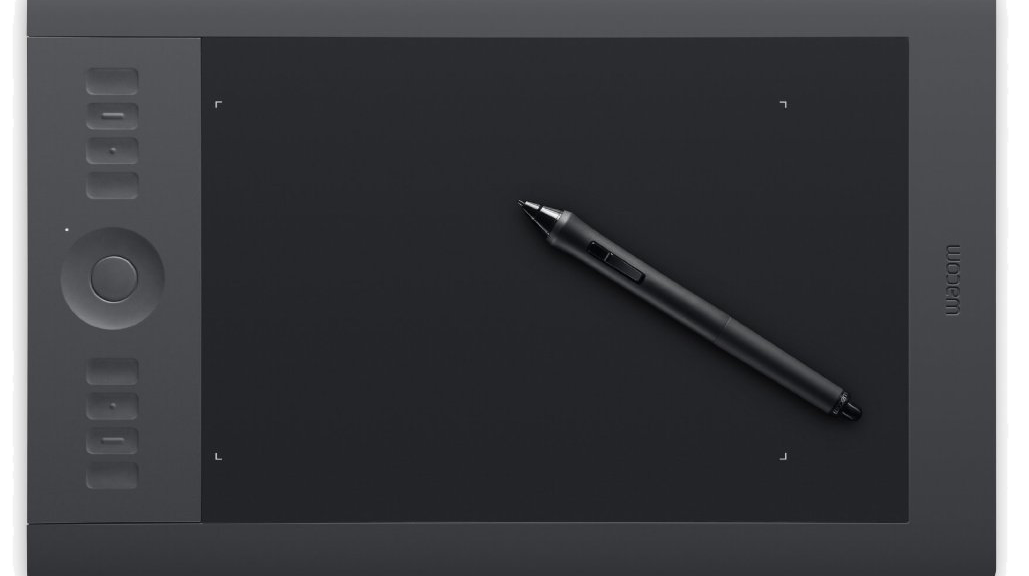
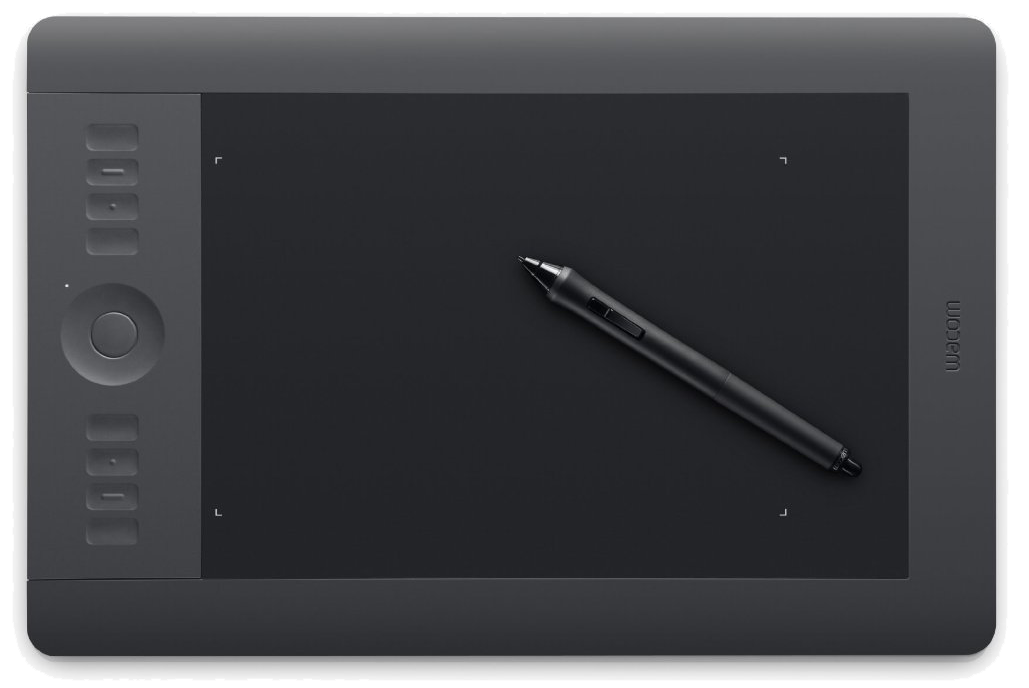
Inspired by Palle Dahlstedt [1], I set out to rapid prototype a way to zoom in on a data stream for live performance. I chose the Wacom tablet since I use this often in live performance with Kyma. I was most fascinated with !PenX (0-1 range), which I often map to the TimeIndex of a sound (0@start of sound, 1@end of sound). Regardless of audio sample length, PenX can be set so 0 will always be the beginning of the sample and 1 will always be the end of the sample. (note: TimeIndex range expects -1 to 1, but PenX range can be easily shifted to fit)
Figure 3. Wacom tablet.
The basic gist of data zooming is that we need two controllers to do the job: a continuous fader (e.g. !PenX) and a button to trigger the zoom (e.g. !PenButton2). The pen/fader equates to the values that we read and in our case, the values that we map onto the TimeIndex of an audio sample.
Data zoom works like this: whenever the zoom button is depressed, we take the current location of the fader and “zoom” in to the location. With zoom enacted, the fader moves at a smaller scale around this location point. The magnitude of zoom can be altered, but for the purposes of this example, I worked with a 10x zoom magnitude. Before jumping into Capytalk and Kyma, let’s walk through my initial prototype inside Max/MSP. The math is the same.
The range of initial values (!PenX) are between 0-1. When the zoom button is depressed, we need to save the current location of !PenX and use as our new zoom location (offset). In addition, we need to alter the range in which !PenX moves through data (scale). I’ve uploaded the Max prototype patch and Kyma file here.
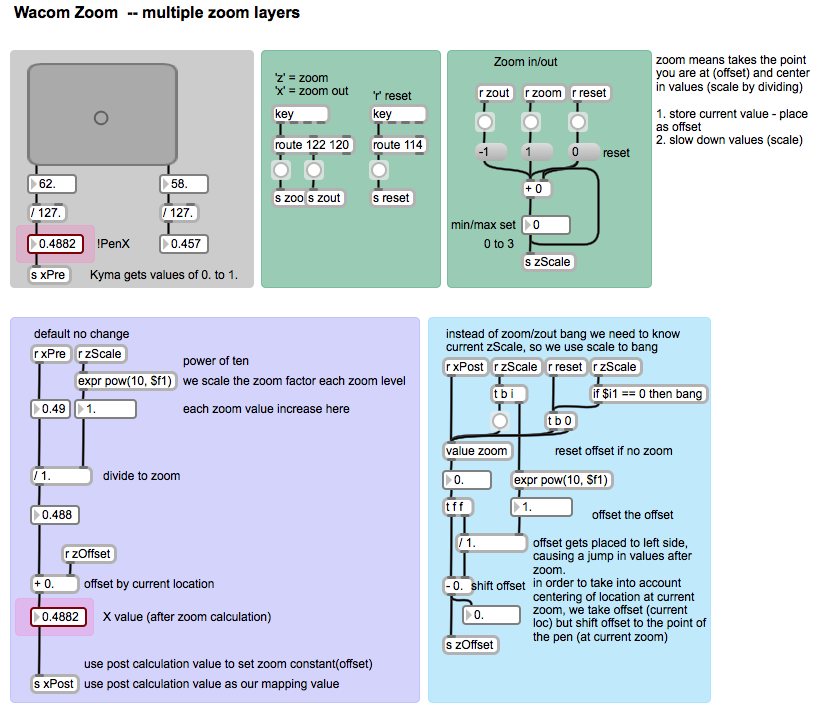
Figure 4. Max/MSP patch prototyping data zooming function.
In order to take into account the centering of the Pen at the current zoom level, I had to add an additional offset that shifts the offset to the actual point of the pen on the tablet. The Max prototype includes multiple zoom levels at powers of 10.
With Kyma, I used the same basic concept. When a button is pressed (!PenButton2), we zoom to the current value of X (sampleAndHold) and magnify the boundaries of !PenX from 0-1 to the zoom order (exponent of 10). Because 10^0 = 1, we can use a button’s press (binary 0 and 1) to create a simple on/off zoom in Kyma.
Figure 5. Simple zoom for data values using the !PenX and !PenButton2.
First, !PenX is scaled down when !PenButton2 is depressed (power of 10). We then add back (offset) PenX’s location from when PenButton2 was pressed. In order to take account of the actual pen location on the tablet, we have to subtract PenX’s sampled location at the same order of the zoom. Lastly, we multiply this offset by !PenButton2 so that when the button becomes 0 (zoom off), the zoom offset no longer effects PenX’s initial, non-zoom state. Thus, with PenButton2 off, the Capytalk is just (!PenX / 1) + 0. Below is a short video sounding the process.